Introduction
Imagine a single undetected EDI error costing your business dollars. Most businesses rely on Electronic Data Interchange to exchange data and streamline operations, but mistakes, delays, and compliance issues can go undetected without proper monitoring.
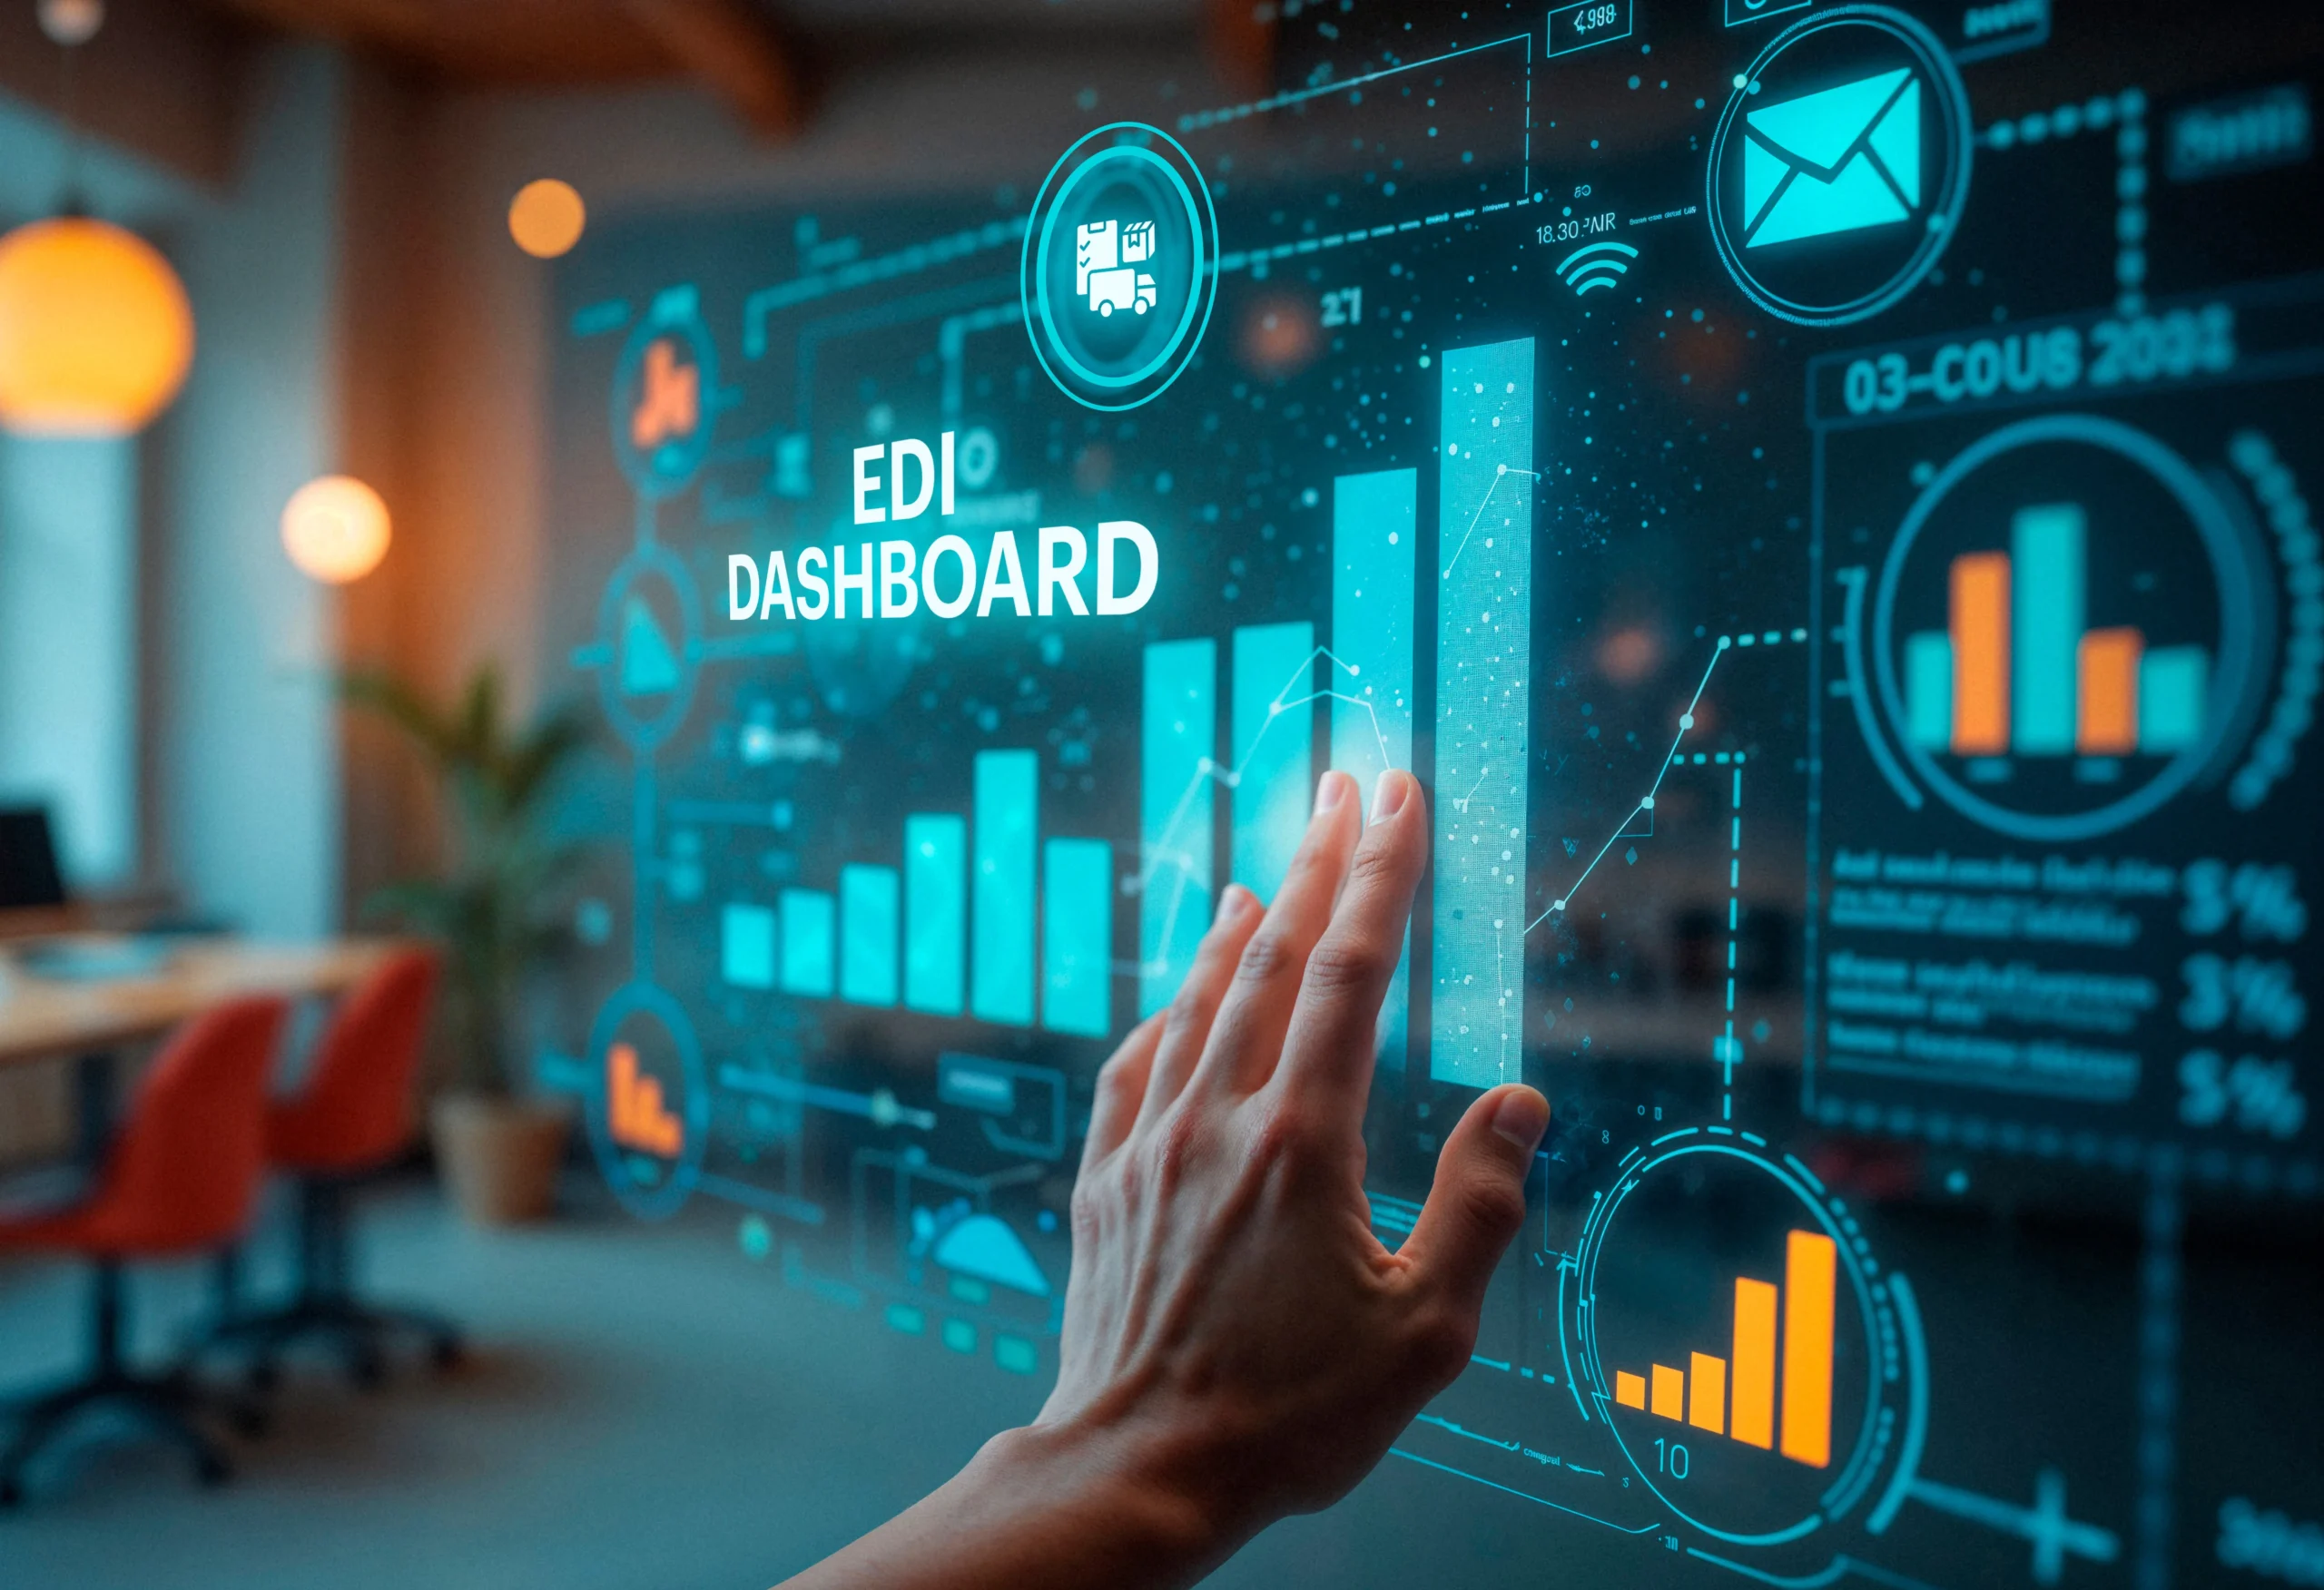
An EDI dashboard addresses all these challenges by transforming raw data into real-time insights. It empowers businesses to proactively manage transactions, identify errors before escalating, and optimize performance. Instead of scrambling to resolve issues after they occur, an EDI Dashboard acts like a centralised command centre with information like status updates, instant alerts, and comprehensive analytics—all in one place.
This guide helps you understand how the EDI Dashboard revolutionises transaction monitoring, saving time, reducing risks, and enhancing operational efficiency.
What is an EDI Dashboard?
An EDI Dashboard is more than just a regular reporting tool. It acts like an interactive platform that provides a unified view of your EDI ecosystem. It collects data from diverse EDI systems and translates it into standard visualisation to empower users to manage and optimise their data exchange process proactively.
Moreover, the EDI dashboard purpose is not limited to essential monitoring; it goes beyond that with:
- An EDI dashboard for real-time monitoring offers insights into the health and performance of your EDI operations, allowing you to identify and address issues in advance.
- Highlighting potential errors allows businesses to proactively manage errors and anomalies to prevent further disruption and maintain smooth data flow.
- It helps to optimize performance by tracking KPIs like transaction throughput, processing times, and error rates.
- Facilitate better collaboration and communication with a shared view of EDI data with all the trading partners.
- EDI dashboard for compliance monitoring simplifies compliance and audit processes with a comprehensive audit trail of all EDI transactions.
Role in Visualizing EDI Processes
EDI Dashboard’s power lies in transforming complex EDI data into intuitive visualizations that unleash hidden patterns and trends. EDI dashboard utilizes a variety of charts, graphs, and tables to present the data concisely, allowing users to interact with specific data points for in-depth insights.
Here is how the EDI transaction monitoring dashboard visualises the EDI process:

- Tailored Dashboard – Boomi EDI dashboards can be tailored to meet user needs for different roles. For example, in the EDI dashboard, an IT administrator might focus on error rates and system performance, while a supply chain manager might look for transactional volumes. The data can be customized to give in-depth insights to different users based on their requirements.
- Real-Time Monitoring – Using real-time updates on the status of individual EDI transactions, stakeholders can track the progress of critical documents and proactively find potential delays.
- Alert and Notification – EDI dashboards can be configured so that they send alerts when a specific or critical event occurs, like a transaction failure or process delay.
- Data Flow Visual Mapping – The dashboard provides a clear understanding of the data exchange process by visually mapping the flow of EDI documents between trading partners and stakeholders.
Comparison to Traditional EDI Monitoring Methods
Traditional EDI monitoring methods involve manual efforts and outdated tools, which result in inefficiencies and delays. Today, the modern EDI dashboard provides real-time data, and an automated approach to EDI management.
Traditional Monitoring Methods vs Our EDI Dashboard
| Features | Traditional Monitoring Methods | Our EDI Dashboard |
| Monitoring of Log Files | Manually reviewing log files is time-consuming and prone to errors. | Dashboards automate the whole process and provide real-time insights. |
| Notifications and Alerts | Relying on email notifications which can be challenging to manage. | Proactive alerts allow users to respond before the issue escalates. |
| Reporting | Generates static reports, which are often outdated while reviewing. | Dynamic real-time dashboards that reflect the current state of EDI operations. |
| Visibility | Limited visibility into the EDI process makes identifying bottlenecks and performance optimisation challenging. | Boomi EDI dashboard offers a holistic view of the entire EDI ecosystem with a comprehensive understanding of data exchange. |
| Real-time Data and Updates | Often, they cannot show real-time data. | Provides real-time and updated information. |
How Does an EDI Dashboard Work?
An EDI Dashboard acts like a command centre, providing instant visibility and control over your EDI transactions and processes. You need an orchestrated integration system, data processing, and visualisation capabilities to achieve this. You have to seamlessly integrate your existing EDI system with the EDI Dashboard, which will collect data from various sources and provide insights into electronic data interchange in a unified and visualised manner.
Here is how the EDI Dashboard works:
1. Integrate with Existing EDI Systems
To begin with, first, seamlessly integrate the EDI Dashboard with your existing EDI infrastructure. The integration is responsible for seamless data flow and real-time system monitoring. This integration intends to create a unified data pipeline that offers a unified view of all the EDI transactions. Integrate EDI with EDI Dashboard by:
- API Connectivity – Application Programming Interfaces are the standard way of data exchange. They are one of the most secure and reliable ways to connect the dashboard with your EDI platforms, trading partners, and internal systems.
- Data Connectors and Adaptors – You can use pre-built custom connectors and adaptors to connect disparate systems and data formats. These connectors can manage the intricacies of data transformation and ensure compatibility among multiple systems.
- Protocol Support – Ensure compatibility with a wide range of EDI protocols so the dashboard can capture data from multiple sources, including X12, EDIFACT, and XML and communication standards like AS2, SFTP, and FTP.
- Data Mapping – Implementing data mapping and transformation rules allows for aligning different data structures from diverse systems to ensure data consistency.

2. Data Collection and Real-Time Processing
Once your EDI system is integrated with the EDI dashboard, it actively collects and processes data from multiple sources in real-time.
- Transaction Logging and Monitoring—Collect detailed information on transaction logs, such as sender and receiver data document types, timestamps, and status updates. This helps create a comprehensive audit trail of all EDI activities.
- Error Detection and Reporting—Implement automated error detection to identify potential issues such as invalid formats, missing fields, or failed communication.
- Metrics Tracking—Monitor key performance indicators like transaction throughput, processing times, and error rates to gain valuable insights into the efficiency and effectiveness of your EDI transactions.
- Real-Time Data Processing – Processing incoming data streams in real time to extract insightful information and generate alerts.
- Data Aggregation and Normalization – Aggregating data from different sources and then turning it into a consistent format for reporting and gaining a holistic view of EDI activities, irrespective of the underlying systems.
3. Transforming Data into Actionable Information
After capturing data from different sources, it is transformed into actionable information. The EDI Dashboard’s UI acts as a wealth of data and insights. It must be intuitive, customisable, and visually engaging.
- Intuitive User Interface – Designing a user-friendly interface for all the users to navigate and access information quickly. A user-friendly interface must have clear menus, intuitive navigation and tailored dashboards.
- Interactive Dashboards – Creating dashboards lets users find specific data points and explore trends and patterns. This way, stakeholders can gain deeper insights and find the root cause if there is any issue.
- Data Visualization Techniques – To present the data concisely, employ various data visualisation techniques, such as charts, graphs, and tales. This helps you understand the trends, patterns, and anomalies clearly.
- Alerting and Notification Systems – Implement a robust alerting system to proactively inform users about critical events like failed transactions or order delays. This will help users respond quickly to issues and minimise disruptions.
- Role-Based Access Control – Implementing role-based access control simplifies identifying relevant information. It also protects sensitive data and maintains confidentiality.
Key Features of an EDI Dashboard
The EDI Dashboard is a central command centre that provides visibility and control of your electronic data interchange operations. It is designed to provide real-time insights, enable proactive issue resolution, and drive operational efficiency by transforming complex EDI data into actionable information. These advanced functionalities empower businesses to optimize their B2B communication.

1. Real-time Transaction Tracking & Error Detection
EDI Dashboard is known for real-time transaction tracking, which provides users with immediate changes to their data exchange. This helps businesses monitor ongoing transactions proactively, detect errors instantly, and take corrective action.
- Live status updates – Monitor the transactions in real-time, along with their statuses, such as “in progress, completed, or failed.” Monitor transactions as they are processed, including statuses such as “In Progress,” “Completed,” “Pending Acknowledgment,” or “Failed.”
- Automated error detection – Improves the process of error detection with automation, identifying failed transactions, missing acknowledgements or formatting errors with clear messages and timestamps.
- Search and filtering options – The EDI dashboard for real-time monitoring allows you to quickly locate specific transactions based on different factors, such as partner name, transaction type, or status.
- Root cause analysis – Businesses can use detailed logs and error codes to determine the root cause of transaction failures and resolve issues quickly.
- Proactive alerts –Real-time notifications and alerts via email and SMS for a failed transaction, missing acknowledgement, or processing delayed beyond defined thresholds.
2. Customizable Reports & Analytics
With powerful EDI dashboards, businesses can extract meaningful data and insights from their transactions. Based on the insights and customisable reporting, the teams can analyse trends, track compliance, and optimise EDI operations. Customised reports and data help the teams work towards their goals instead of filtering out the required data.
- Predefined & customisable reports – Tailored and ready-to-use ports with filters like transaction volume, partner performance or error rates to save time on finding the required information with manual efforts.
- Exportable formats – Businesses can download the reports in CSV, PDF, or Excel and export them for further analysis and compliance audits.
- Historical transaction logs – In-depth analytics can help you track past transactions over a specific timeline, identify recurring issues or patterns, and design future solutions accordingly.
- Real-time dashboards – Data visualisation of all the KPIs like document processing speed, transaction success rates or peak transaction times in real-time.
- Trend forecasting – Study patterns using analytics tools to identify trends over time. This allows stakeholders to predict volume or customer spikes and be ready for scalability and management.
3. User Access Controls & Security
Securing sensitive EDI transactions is necessary to maintain data integrity and prevent unauthorized access. Role-based access control ensures that sensitive data is not accessible to all and also complies with industry security standards.
- Role-based access control – The Boomi EDI dashboard allows you to grant access to stakeholders and departments based on their respective roles, such as finance, administrators, operations, or IT.
- Data encryption – You can prevent data breaches with secure transactions using encryption standards like SSL/TLS.
- Audit logs and activity tracking – Ensure transparency and accountability by maintaining a record of user actions like logins, transaction modifications, and report downloads to address the authority in terms of any crisis.
- Multi-factor authentication (MFA) – Secure sensitive data and information with additional authentication layers to prevent unauthorised access.
4. Seamless Integration with Business Systems
An EDI dashboard with integration capabilities simplifies connecting with business systems like ERP, CRM, and WMS. Businesses can now easily track multiple systems’ EDI transactions in one place.
- Seamless ERP & CRM integration – Synchronise transactional data of multiple systems and applications in real-time by connecting with enterprise applications like NetSuite, SAP or Oracle.
- Data transformation & mapping – Convert the data into different formats (EDL, XML, CSV) to ensure compatibility with other systems within the EDI dashboard.
- Scalability – The EDI dashboard with integration capabilities effortlessly adapts to growing transaction volume and load with cloud-based infrastructure and API-driven integrations.
5. Cost Savings & Business Efficiency
A well-designed EDI dashboard helps businesses reduce operational costs by automating processes, preventing errors, and improving business efficiency by quickly processing all operations.
- Reduced manual data entry – Automation eliminates the errors caused by manual efforts, saving time and resources required to address these errors, rework them and compliance fines.
- Lower transaction processing costs – Electronic Data Interchange reduces paper-based transactions, saves the investment required to share data, and cuts mailing expenses and administrative efforts.
- Improved operational efficiency – Boost order processing speed and invoice reconciliation to enhance cash flow and customer satisfaction.
- Optimised resource allocation – By automating repetitive tasks and data exchange, teams can focus more on strategic tasks rather than spend time on error finding and resolution.
6. Correlation of EDI Documents & Transactions
A well-structured EDI dashboard should link related transactions clearly, ensuring smooth business workflows and accurate reconciliation.
- Linked document tracking – Track the life cycle of EDI transactions, such as linking purchase orders to invoices and shipment notices.
- Cross-reference functionality – Ensure data integrity by matching acknowledgements with their corresponding transactions to ensure document integrity.
- Exception handling – Manage the supply chain by automating flag discrepancies between orders, shipments, and invoices and quickly resolving errors.
7. Partner Performance Dashboard & Management
Managing and evaluating trading partners is necessary to maintain an efficient supply chain and ensure compliance. An EDI dashboard lets you track and gain insights into a dedicated partner’s performance.
- Performance metrics tracking – Track trading partners’ performance and measure efficiency based on transaction success rates, error rates, and response times.
- Compliance monitoring – The EDI dashboard ensures trading partners meet agreed-upon SLAs and compliance standards.
- Scorecards & benchmarking – Identify areas of improvement by comparing partner performance against industry benchmarks.
- Automated dispute resolution – Maintain transparency by tracking disputes related to incorrect transactions, delays, or compliance breaches.
Why Choose NeosAlpha for your EDI Dashboard Needs?
As an awarded Boomi partner, NeosAlpha delivers exceptional EDI dashboard solutions specially designed to provide instant visibility and control over the EDI process. We leverage the power of Boomi’s capabilities to offer a powerful combination of integration and EDI.
Here’s why NeosAlpha is the ideal choice for your EDI dashboard needs:
- Faster Error Tracking and Resolution
Our EDI dashboard solution implements robust monitoring probes that consistently track all EDI transactions and enable quick error identification. We configure an intelligent and quick-to-response alert system that instantly notifies stakeholders about EDI status changes for swift action. These rapid responses ensure operational efficiency and minimum downtime.
Example: Our luxury home furniture retailer’s client struggled to manage EDI transactions across different platforms, such as Magento, NetSuite, and Korber 3PL. This resulted in delays and problems in fulfilling orders. We developed an EDI dashboard to track purchase orders, invoices, and shipping notices for continuous data flow among all systems. Automating error detection and alerts accelerated the process. Our client also achieved visibility into transactions and partner performance. - Easy-to-Drive Business Insights
We developed real-time dashboards that offer a unified view of all EDI transactions. This centralized view helps identify trends, analyse performance, and make informed decisions. Our Boomi expertise helps us gather data from multiple sources and offer a comprehensive business perspective. - Expertise Across Integration Platforms
Our significant experience and expertise in integrating EDI dashboards with various integration platforms, such as Boomi and NetSuite, help us create customised dashboards. Our solution offers end-to-end visibility across EDI transactions and your connected system.
Example: A leading IT distributor struggled to manage B2B transactions due to poor visibility, different data formats, and dependency on manual efforts in their EDI process. Exchanging documents in various formats with multiple trading partners was a challenge. To address this, we developed a comprehensive EDI dashboard powered by Boomi EDI. It provided real-time transaction monitoring, automated error detection, and seamless data exchange. Our solution helped them to reduce manual dependency by 60% and enhance processing speed by 40%. Now, they have real-time visibility into B2B transactions, ensuring quick issue resolution and enhanced partnerships.
Conclusion
EDI inefficiencies don’t just slow you down—they cost you money. Without real-time insights, every failed document, unnoticed delay, or compliance risk can strain partners’ relations. A well-designed EDI dashboard eliminates the guesswork, provides instant visibility and proactive alerts, and gives you the power to take control of your B2B exchanges.
With an effective EDI dashboard solution, you can reduce operational costs and manual efforts and optimise partner collaboration with smooth data flow across the organisation.
Take charge of your EDI operation and turn those inefficiencies into opportunities.
FAQs
1. What Makes a Good EDI Dashboard?
A good EDI dashboard provides automation, real-time visibility, and actionable insights to streamline B2B transactions. To ensure accurate data exchange, it must have features like error tracking, data validation, transaction monitoring, and compliance reporting. The dashboard must also support tailored views for different stakeholders.
2. How to Design Effective EDI Dashboards?
Identify key metrics like transaction success rates, processing times, and error logs. Using intuitive visualisation, implement real-time monitoring and automated alerts for quick issue resolution. The dashboard must integrate with existing EDI systems to gain deeper insights. Contact us to get an effective EDI Dashboard.
3. How does a Boomi EDI dashboard enhance integration efficiency?
Boomi EDI dashboard enhances integration efficiency by automating B2B data exchange, reducing errors, and ensuring connectivity between all cloud and on-premise applications. It also provides end-to-end visibility into transactions for quick issue resolution. Businesses can leverage Boomi’s built-in connectors and pre-configured workflows to accelerate partner onboarding and streamline EDI operations.
4. What analytics and KPIs should businesses track on an EDI dashboard?
To fully leverage the potential of an EDI dashboard, businesses should track metrics like transaction success rates, error frequency, order processing speed, invoice reconciliation status, and partner compliance adherence. For more insights, you can also analyse trend forecasting, exception management reports, and supply chain efficiency metrics to optimise your EDI strategy and enhance B2B collaboration.
5. How do you integrate an EDI dashboard with ERP and supply chain systems?
You can use an API-driven or middleware approach like Boomi to integrate the EDI dashboard with ERP and supply chain. Businesses can also use pre-built connectors to sync the EDI data with platforms like NetSuite, SAP, or Oracle to ensure effortless order processing, inventory updates, and financial reconciliation. To leverage the full potential of the EDI dashboard, you can connect to our experts.